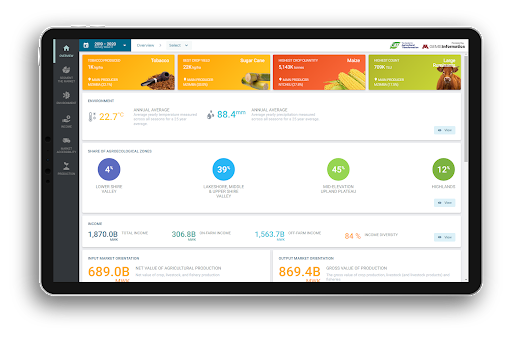

The Malawi Market Segmentation Dashboard is an interactive tool that uses hyper-curated LSMS-ISA Wave 3, Wave 4 & Wave 5 data, along with other 3rd party data (e.g., climate, population, elevation) to spatially characterize farmers, farms and their farming practices and enables users to identify target market sheds.
It is a joint venture between GEMS agroinformatics, CAT and Venture37 on behalf of The Foundation for a smoke-free world.
The mission of the Foundation's Agricultural Transformation Initiative (ATI) is to prepare smallholder tobacco farmers for an era of significantly reduced demand for tobacco, focusing first on populations with the greatest need.


The Malawi Market Segmentation Dashboard is an interactive tool that uses hyper-curated LSMS-ISA Wave 3, Wave 4 & Wave 5 data, along with other 3rd party data (e.g., climate, population, elevation) to spatially characterize farmers, farms and their farming practices and enables users to identify target market sheds.

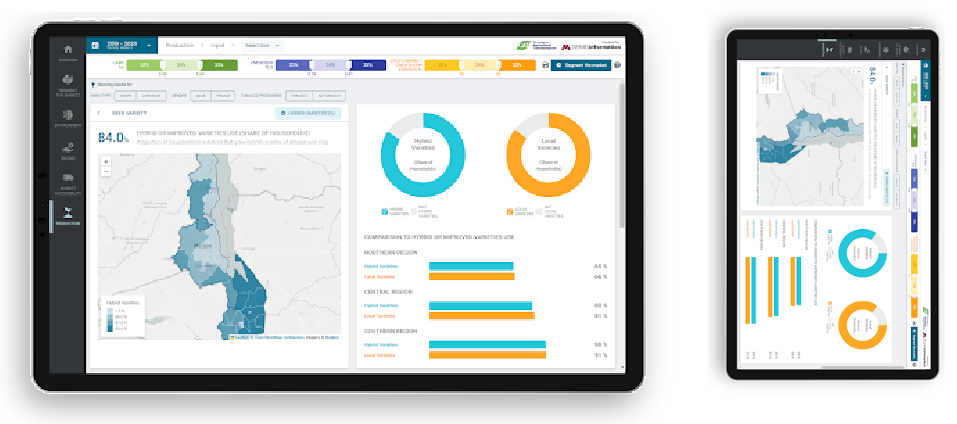
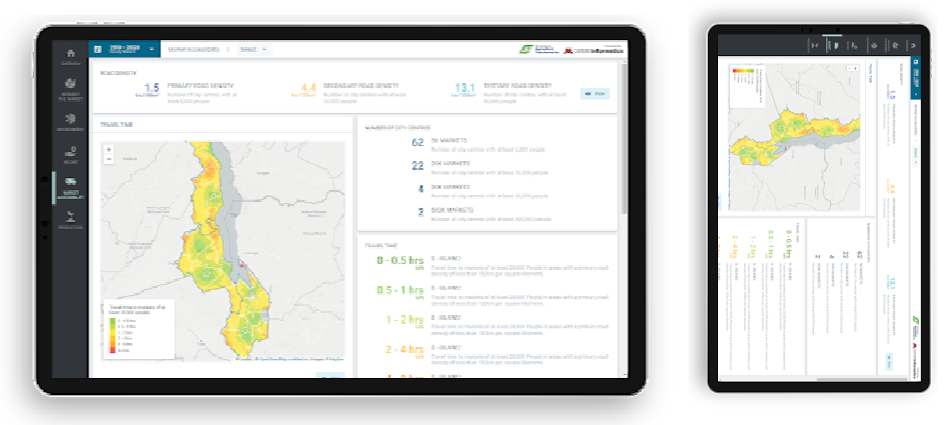
The dashboard incorporates detailed raster map layers showing key agricultural and demographic data across Malawi. Users can visualize and analyze spatial patterns of crop production, soil conditions, population density, and other important variables through an intuitive map interface with customizable overlays.
Dynamic data visualizations and infographics allow users to explore complex relationships between different agricultural indicators. The interactive charts and graphs update in real-time as users filter and segment the data, making it easy to identify trends and patterns across different regions and time periods.
The system seamlessly integrates multiple data sources including LSMS-ISA survey data, climate records, and satellite imagery. This comprehensive data integration enables rich analysis combining socioeconomic indicators with environmental and geographical factors to provide deeper insights into agricultural patterns.
Advanced analytics tools allow users to perform custom queries and analysis on the integrated dataset. Features include demographic segmentation, trend analysis, and predictive modeling to help identify optimal areas for agricultural interventions and market development opportunities.