The Redtrac system is designed to manage various agricultural devices and sensors. Utilizing the data captured from these devices, the system creates both geographical and data-driven views, assisting end-users in making informed decisions. This centralized platform enables agricultural stakeholders to monitor devices, enhancing resource utilization and productivity.
The project's primary goal is to enable efficient interactions between users and their agricultural devices and sensors, ultimately enhancing decision-making. By offering comprehensive data visualization—both geographical and analytical—the platform helps users understand their operational environment better, simplifying device management
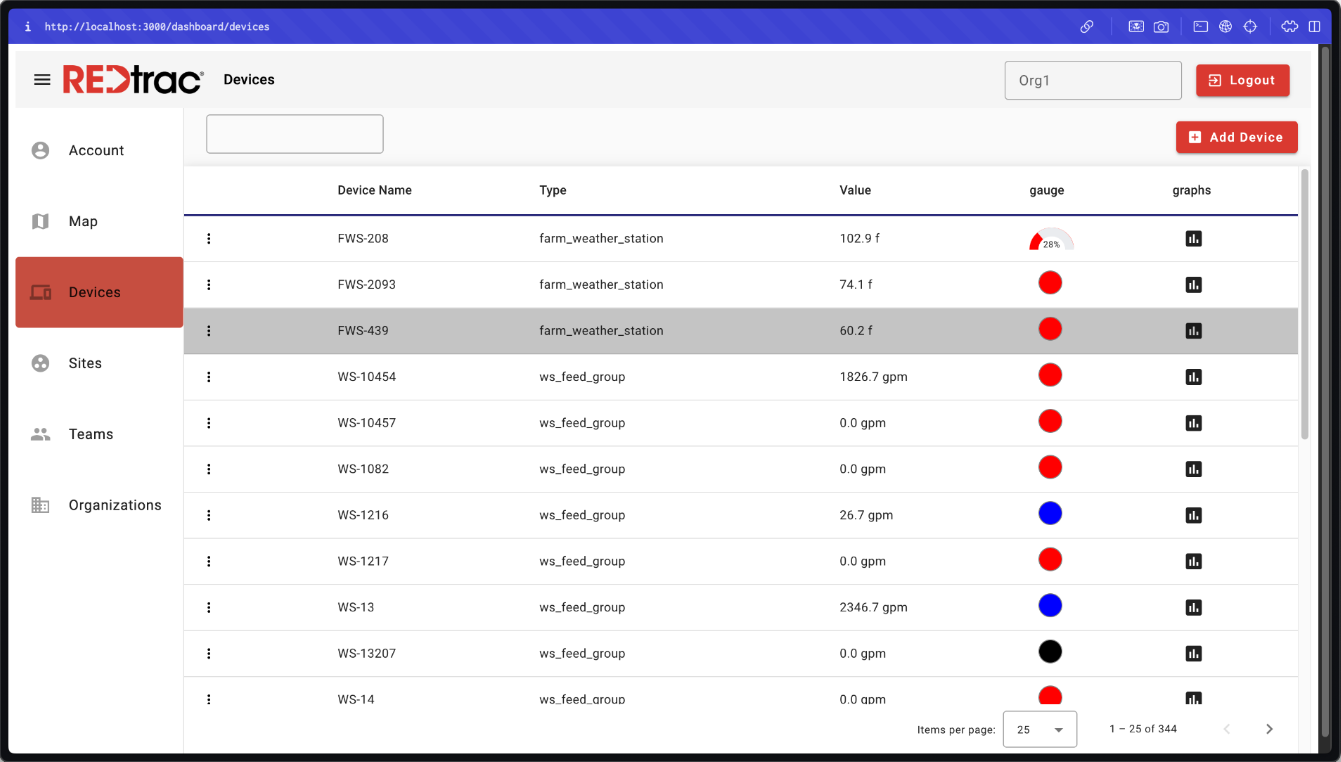
Devices are equipped with multiple sensors, allowing users to monitor status and performance. The device monitoring screen displays a comprehensive list of devices with their current values, types, and performance gauges.
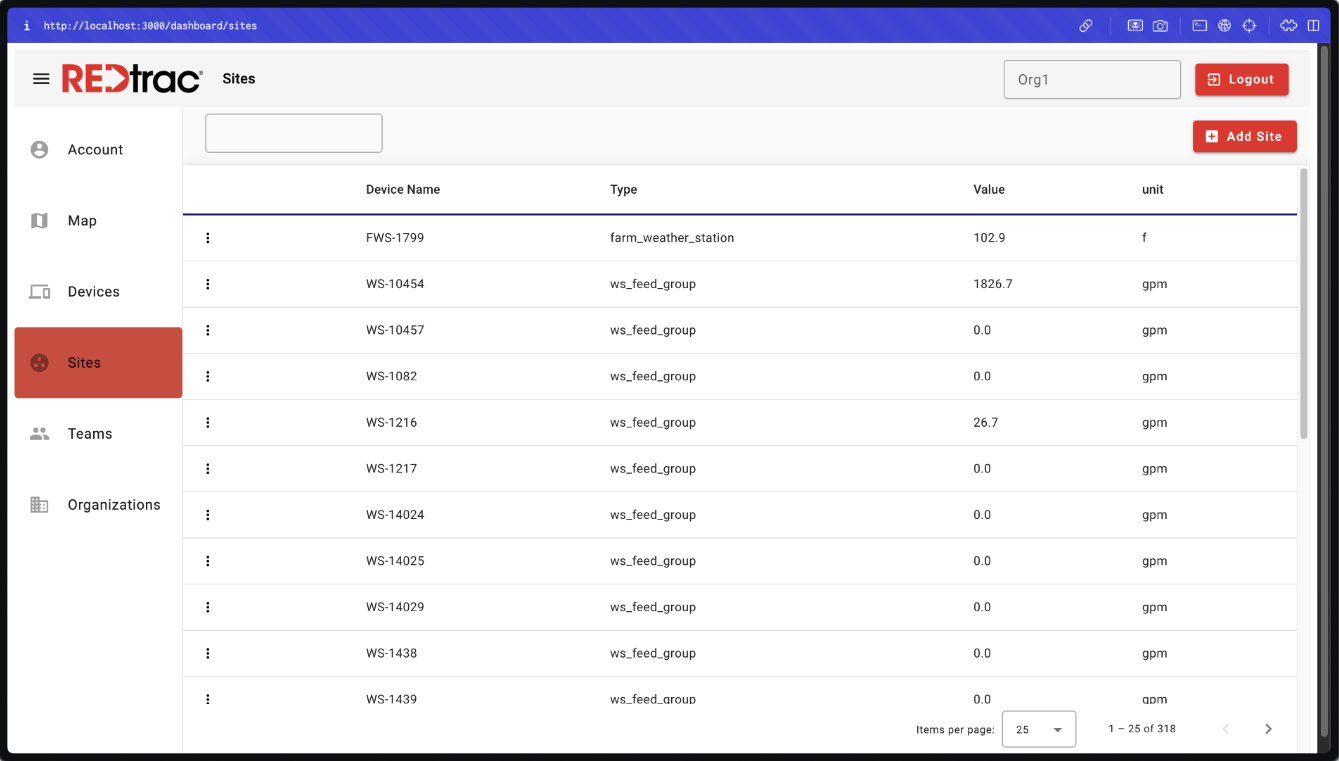
Users can monitor geographic sites containing multiple devices, enabling them to view aggregated data. The site monitoring screen displays a comprehensive list of sites with their current values and units.
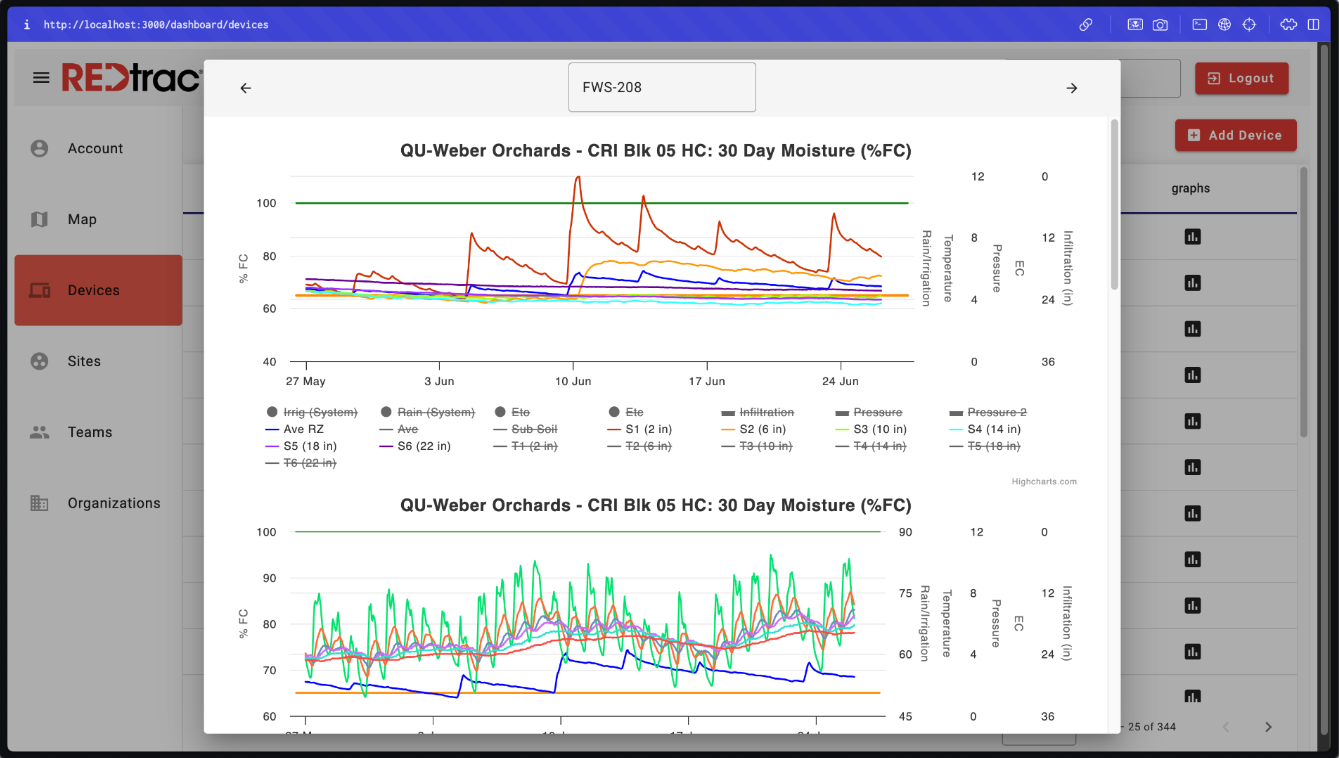
Real-time data from devices and sites is shown in tables, with historical data visualized in graphs. The data graphs screen provides users with a graphical representation of historical data trends, allowing them to track and predict changes over time.
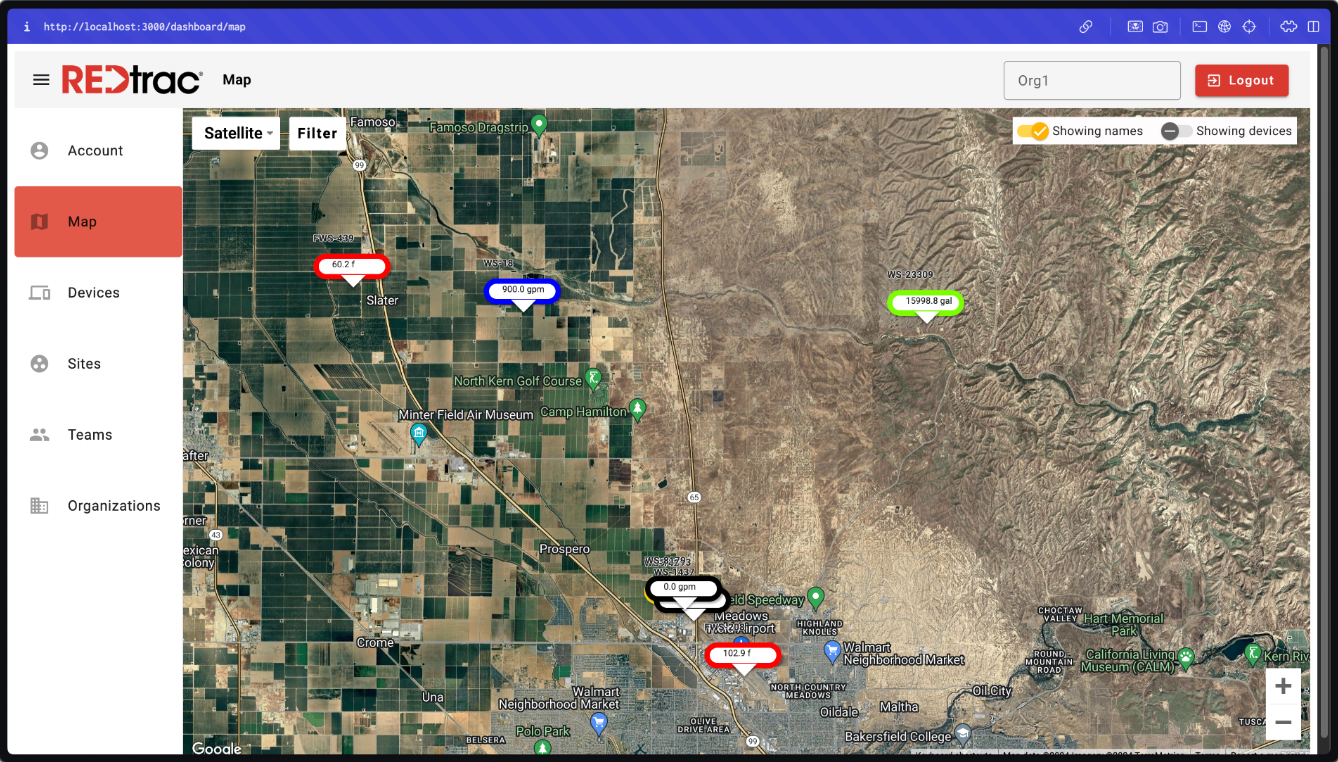
Devices and sites are visualized on a map, with status indicators for quick reference. In the map view, markers and color codes indicate device status, enabling users to quickly identify and address potential issues.
